I've been helping a client identify some performance issues with a new hosting platform they're in the process of commissioning.
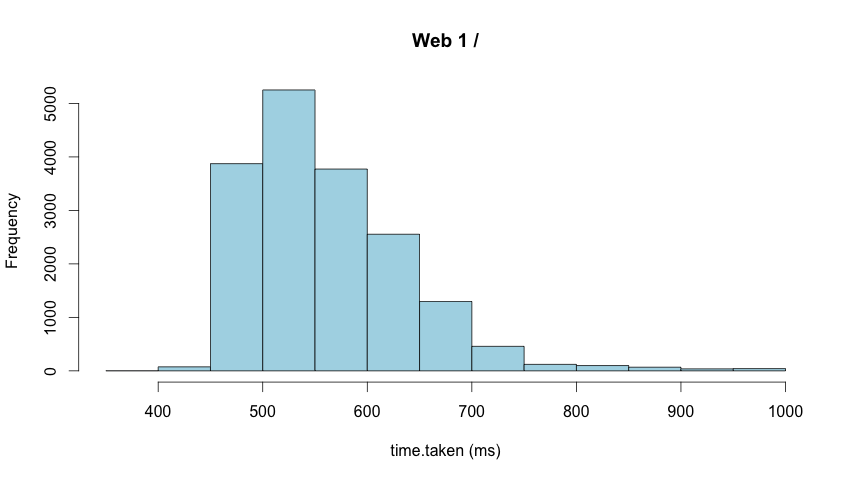
The new platform has New Relic running but unfortunately it only provides an average for response times. Averages can hide all manner of sins so I prefer to look at the distribution of response times, I also wanted a way to compare against the existing platform which has no monitoring on it.
The method I chose was to add time taken to the IIS logfiles and plot histograms using R.
(Time taken includes network time which may be an issue in some scenarios)
R is a tool for statistical computing that makes crunching numbers and turning them into graphs relatively easy. When I first started using R I found it had a bit of a learning curve and I still have to work had to do anything that's not trivial but that's probably a mixture of all the statistical knowledge I've forgotten and the language / libraries.
IIS logfiles start with a multi-line header (sometimes they can have one part way through too!) that looks like this
#Software: Microsoft Internet Information Services 7.5
#Version: 1.0
#Date: 2013-05-31 00:00:02
#Fields: date time s-sitename s-computername s-ip cs-method cs-uri-stem cs-uri-query s-port cs-username c-ip cs-version cs(User-Agent) cs(Referer) cs-host sc-status sc-substatus sc-win32-status sc-bytes cs-bytes time-taken
2013-05-31 00:00:13 W3SVC1 WEB1 171.12.3.100 GET / - 80 - 172.16.3.254 HTTP/1.0 - - 171.12.3.100 200 0 0 81455 56 545
2013-05-31 00:00:18 W3SVC1 WEB1 171.12.3.100 GET / - 80 - 172.16.3.254 HTTP/1.0 - - 171.12.3.100 200 0 0 81455 56 592
2013-05-31 00:00:23 W3SVC1 WEB1 171.12.3.100 GET / - 80 - 172.16.3.254 HTTP/1.0 - - 171.12.3.100 200 0 0 81455 56 561
2013-05-31 00:00:28 W3SVC1 WEB1 171.12.3.100 GET / - 80 - 172.16.3.254 HTTP/1.0 - - 171.12.3.100 200 0 0 81455 56 577
   .
   .
Most of the header needs stripping off so we're just left with a tab separated set of field headers
date time s-sitename s-computername s-ip cs-method cs-uri-stem cs-uri-query s-port cs-username c-ip cs-version cs(User-Agent) cs(Referer) cs-host sc-status sc-substatus sc-win32-status sc-bytes cs-bytes time-taken
2013-05-31 00:00:13 W3SVC1 WEB1 171.12.3.100 GET / - 80 - 172.16.3.254 HTTP/1.0 - - 171.12.3.100 200 0 0 81455 56 545
2013-05-31 00:00:18 W3SVC1 WEB1 171.12.3.100 GET / - 80 - 172.16.3.254 HTTP/1.0 - - 171.12.3.100 200 0 0 81455 56 592
2013-05-31 00:00:23 W3SVC1 WEB1 171.12.3.100 GET / - 80 - 172.16.3.254 HTTP/1.0 - - 171.12.3.100 200 0 0 81455 56 561
2013-05-31 00:00:28 W3SVC1 WEB1 171.12.3.100 GET / - 80 - 172.16.3.254 HTTP/1.0 - - 171.12.3.100 200 0 0 81455 56 577
   .
   .
Once the data is in a format we can use, it needs to be imported into R, filtered and plotted as a histogram.
R has a command shell but I prefer to use R Studio when I'm exploring data.
- Import logfile
data = read.table("path.to.logfile/logfile.name", header=T, sep="")- Filter data
Here I'm only including GET requests for the root that took less than a second (there are a few over a second that skewed the chart, of course the outliers may be interesting in their own right so be careful about removing them)
subset <- subset(data, cs.method=="GET" & cs.uri.stem=="/" & time.taken < 1000)- Plot Histogram
hist(subset$time.taken, xlab="time.taken (ms)", col="lightblue", main="Web 1")
This may be a very simple example but hopefully it goes some way to showing the power of R.
If you need any convincing that you'd benefit from learning some statistics, @zedshaw's Programmers Need To Learn Statistics Or I Will Kill Them All might help you.