Improving site speed comes with a cost, it might be the opportunity cost of switching from developing features to working on performance improvements, the cost of buying or deploying performance tools, engaging consultants or the direct cost of work itself — especially when a site relies on an external development partner.
As performance advocates we’d champion the idea that improving performance adds value, sometimes the value is tangible – increased revenue for a retailer, or increased page views for a publisher – other times it may be less tangible – improvements in brand perception, or visitor satisfaction for example.
But as important and valuable we might believe speed to be, we need to persuade other stakeholders to prioritise and invest in performance, and for that we need to be able to demonstrate the benefit of speed improvements versus their cost, or at least how slow speeds have a detrimental effect on the factors people care about – visitor behaviour, revenue etc.
“Isn’t that case already made” you might ask?
What about all the case studies that Tammy Everts and Tim Kadlec curate on WPOStats?
Case studies are a great source of inspiration, but it’s not unusual to hear objections of "our proposition is different, our site is different, or our visitors are different" and often there’s truth to these objections.
The chart below shows how conversion rates vary by average load time across a session for three UK retailers.
(Ideally I’d like a chart that doesn’t rely on averages of page load times but sometimes you’ve got to work with the data you have)
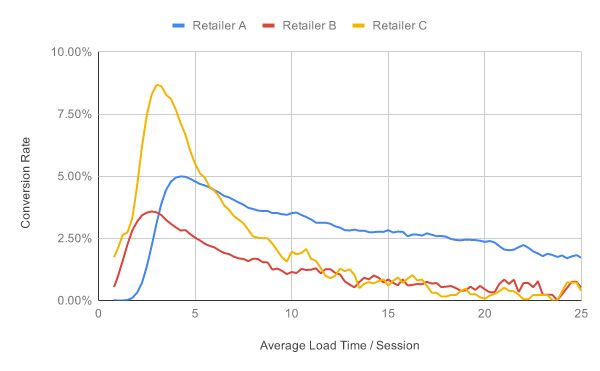
Although the trend for all three retailers is similar – visitors with faster experience are more likely to convert – the rate of change is different for each retailer, and so the value of improved performance will also vary.
As examples of how this value varies, one retailer I worked with saw a 5% increase in revenue from a 150ms improvement in iOS start render times, another increased Android revenue by 26% when they cut 4 seconds from Android load times and a third saw conversion rates improve for visitors using slower devices when they stopped lazy-loading above the fold images.
Other clients have had visitors that seemed very tolerant of slower experiences calling into the question the principle that being faster makes a difference for all sites, and what value investing in performance would deliver.
If case studies aren’t persuasive enough or maybe not even applicable for some sites, how do we help to establish the value of speed?
Identifying the Impact of Performance Improvements
Determining what impact a performance improvement had on business metrics can be challenging as the data is often split across different products, and a change in behaviour may only be visible for a subset of visitors, perhaps those on slower devices, or with less reliable connections.
This difficulty can lead us to depend on what Sophie Alpert describes as ‘Proxy Metrics’ such as file size, number of requests, or scores from tools like Lighthouse – if our page size or number of requests decreases, or our Lighthouse score increases then we’ve probably made a positive difference.
Haven’t we?
Relying on proxy metrics brings a danger that we celebrate improvements without knowing whether we actually made a difference to our business outcomes, and the risk that changes in business metrics are credited to other sources, or worse still, we remove something that actually delivers more value than it costs.
In Designing for Performance, Lara Hogan advocates the need for organisational cultures that value site speed at the highest levels rather than relying on Performance Cops and Janitors.
Linking site speed to the metrics that matter to senior stakeholders is a key part of that but as a performance industry / community I think we probably rely on an ad-hoc approach to making that link.
Relationship Between Site Speed and Business Outcomes
In June 2017, I had a bit of a realisation…
At the time I was employed by a web performance monitoring company, and one of our ongoing debates was about what data our Real User Monitoring (RUM) product should collect.
Simon Hearne and I worked with clients to identify and implement performance improvements, and then post implementation we were trying to quantify the value of those improvements.
As we identified gaps between the data our RUM product collected and the data we wanted, we would ask for new data points to be added but kept running into resistance from our engineering team who were often skeptical about the value of the new data.
We were in a ‘chicken and egg’ situation – our engineering team didn’t want to collect the data unless we could prove it had value, but Simon and I couldn’t establish whether it had value until we started collecting it.
We were missing a framework that might help us make these decisions, one that could help everyone understand what data we could collect, and what questions that data might help answer.
At some point while I was thinking about our challenge, I created a deck with a slide similar to this one:
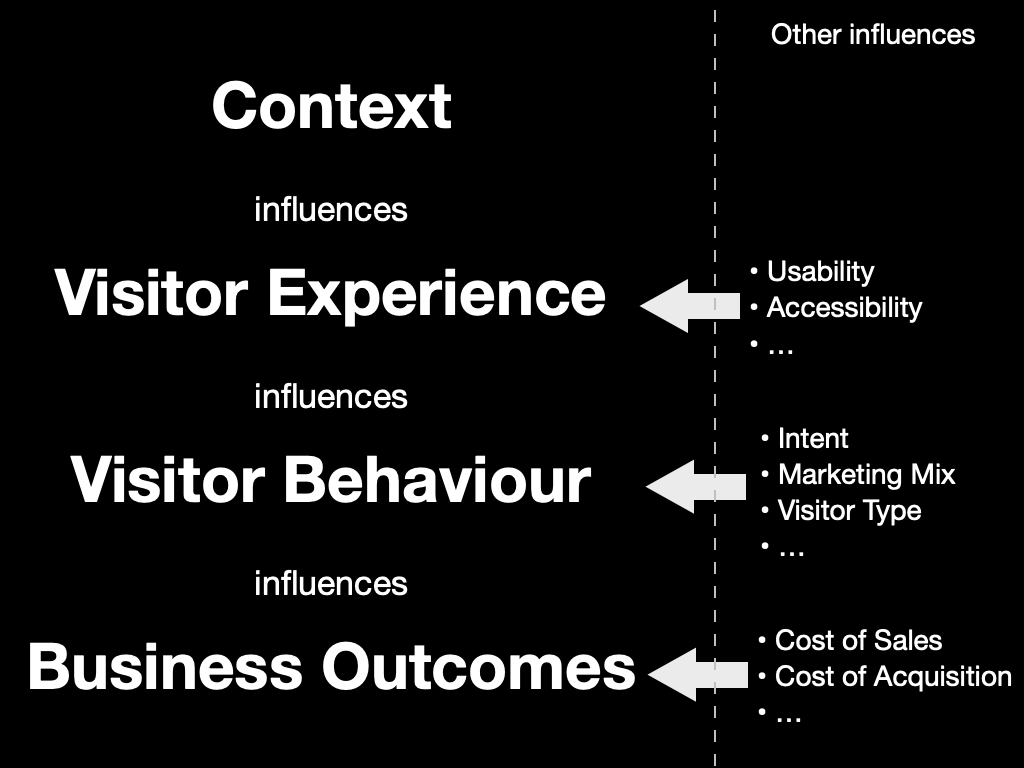
Concepts such as “how we build pages influence our visitors’ experience”, “the experience visitors get influences how they behave”, and “how visitors behave influences our sites’ success” are commonplace in web performance.
After all, these are concepts that underpin many of the case studies on WPOStats.
But… I’m not sure I’d ever seen them written down as an end-to-end model before.
And writing them down on one slide helped me realise what my mental model of web performance actually looked like.
It’s also become a lens through which I view one of Tammy’s questions in Time is Money – “How Can We Better Understand the Intersection Between Performance, User Experience, and Business Metrics?”
Other slides in the deck explained those categories, and what metrics might be included within them:
- Context
What a page is made from, how those resources are delivered, the device it’s viewed on and the networks it was transmitted over are all fundamental to how fast and smooth a visitor’s experience is.
Some of those factors – browser, device, and network etc. – have a crucial impact on how long our scripts take to execute, how soon our resources load etc., but as they are all outside our control, they’re really constraints we need to design for.
Other factors such as the resources we use, whether they’re optimised, how they’re delivered and composed into a page also have a huge effect on a visitor’s experience and this second set of factors is largely within our control, after all these are the things we change when we’re improving site speed.
- Visitor Experience
From a performance perspective visitor experience is synonymous with speed – when did a page start to load, when did content start to become visible, how long did key images take to appear, when could someone interact with the page, were their interactions responsive and smooth etc.
We’ve plenty of metrics to choose from, some frustrating gaps and the ability to synthesise our own via APIs such as User Timing too.
There are other factors we might want to consider under the experience banner too – are images appropriately sized, does the product image fit within the viewport or does the visitor need to scroll to see it, what script errors occur etc.
- Visitor Behaviour
How visitors behave provides signals as to whether a site is delivering a good or bad experience.
At a macro level, a visitor buying the contents of their shopping basket is seen as a positive signal, whereas someone navigating away, or closing the tab before the page has even loaded would be a negative one.
Then at the micro level there are behaviours such as whether a visitor reloads the page, rotates their device, or perhaps zooms in, how long they wait before interacting, how much they interact etc.
There are also other, non-performance factors that influence visitors behaviour – their intent, the marketing mix, social demographics factors – that we may or may not want to include when we’re considering behaviour.
- Business Outcomes
Individual user behaviour can be aggregated into metrics we use to run our businesses – conversion rates, bounce rates, average order values, customer lifetime value, cost of acquisition etc. – and ultimately revenue, costs and profit.
Limitations of the Model
“All models are wrong; some models are useful”, George E. P. Box
Every model has limitations, and while site speed might be our focus, it isn’t the only driver of a site's success.
- A visitor’s experience is much more than just how fast it is – content, visual design, usability, accessibility, privacy and more all contribute to the experience.
- The type of visitor, their intent, the marketing mix (product, price, promotion etc.) and more influence how people behave.
- Factors such as cost of acquisition, product margin, returns etc. affect the success of our business
Our challenge is identifying what role site speed played in influencing the outcomes.
I’ve also got outstanding questions about how design techniques that improve perception of performance, such as those Stephanie Walter covers in Mind over Matter: Optimize Performance Without Code fit into the model too.
There are also questions about whether it’s possible, desirable, and even acceptable to gather some of the data points we might want.
But…
Even with its limitations, I still find the model very useful as a tool to help communication and build understanding.
It helps facilitate discussions around the metrics we’re capturing (or could start capturing) and what those metrics actually represent.
It’s handy when making changes as we can discuss what effect we expect to see from a change – which metrics should move, in what direction, and how that might affect visitor behaviour.
I’ve also had some success tracking changes in how pages were constructed all the way to changes in business outcomes, particularly revenue but often the data on speed, visitor behaviour and business performance is stored in separate products and the gap between them can make analysis hard.
Bridging the Gap
If our thesis is that the speed of a visitor’s experience influences their behaviour then we need tools that allow us to capture, and analyse data on both visitors’ experience and their behaviour in the same place.
This is where the gaps in analytics and performance tools start to show:
- Analytics products tend to focus on visitor acquisition and behaviour but generally don’t capture speed data. Those that do collect speed data, only support limited metrics, have low sample rates and expose the data as averages.
- Real-User Monitoring (RUM) products tend to focus on speed, some capture a wider range of metrics and a few capture some data on visitor behaviour such as conversion, bounce and session length.
- Some Digital Experience Analytics products (Session Replay, Form Analytics etc) collect speed data alongside visitor behaviour but only one product exposes the cost of speed in their product.
- Performance Analysis tools such as WebPageTest and Lighthouse give us a deeper view into page performance including construction and delivery but can’t capture data on either real-visitors’ experience or their behaviour.
There are limits to what data it’s possible, practical or acceptable to collect and store but ideally I’d also like data on how a page is constructed and delivered, along with some business data to be stored in the same place too.
Although it’s easy to think of all RUM products as comparable, some are more capable than others and a few RUM products have tried to close some of the gaps but there is still much to be done.
I track the features and capabilities of over thirty RUM products and too many of them focus on just monitoring how fast a site is, often only using a few aggregated metrics (DOMContentLoaded / Load).
Other products support perceived performance metrics such as paint and custom timings, and some include data on page composition too – number of DOM nodes, scripts etc.
Very few products capture data on visitor behaviour, some plot conversion or bounce rates alongside speed metrics, others build predictive models showing the value speed improvements could bring – reduced bounce rates, higher conversion rates, increased session lengths etc.
For filtering and segmentation products tend to focus on contextual dimensions such as browser make and version, operating system, ISP, device type, country etc., rather than behavioural dimensions such as whether a visitor converts or bounces etc.
This focus on technical dimensions and metrics rather than visitor behaviour means it can often be hard to answer the questions I often want to ask.
Questions such as, how does performance differ between visitors who convert, and those that don’t?
Or which visitors have slow experiences and why?
Or what areas of a site should we focus first on when improving performance?
And much more…
Ultimately I want to be able to segment based on a variety of factors including how visitors behave, the experience they have and how the pages they view are constructed.
I want to be able to highlight not just how speed impacts visitors’ behaviour and what it costs, but why some visitors have slower experiences and perhaps even what changes can be made to improve them.
And once we’ve made improvements I want to be able to link changes in behaviour, and gains in business metrics back to those performance improvements.
Closing Thoughts
It’s easy to get excited about new techniques for measuring and improving site speed but this focus on the technical side of performance can lead us to think of speed as a technical issue, rather than a business issue with technical roots.
As Harry Roberts said in his 2019 Performance.Now talk – “Our job isn’t to make the fastest site possible, it’s to help make the most effective site possible”
But to help make more effective sites we need tools that make it easier to understand how speed is influencing visitors' behaviour, easier to identify key areas where performance needs to improve and perhaps even recommend actions they can take to improve it.
We also need models that help link the way sites are constructed and delivered to the business outcomes, so that we understand how the changes affect visitors and allow for features that might make pages a bit larger, a little slower but improve engagement and deliver higher revenues.
My mental model is still a work in progress and I’m not wedded to it, so feel free to suggest alternatives, poke at its gaps or better still, suggest ways we can fill the gaps.
Ultimately, there are too many RUM products that just measure how fast or slow a visitors experience is, and are unable to link that experience to a site's success.
If we want to make the web faster we've got to close that gap.
Thanks
I started this post a couple of years ago while I was taking some time off after helping sell NCC Group's web performance business.
Since then I've talked to quite a few people about the ideas in it and I'm grateful to them for sharing their challenges and experience or giving me feedback.
Finally, Colin, Dave, Jeremy, Simon and Tim were kind enough to my read my draft post, spot my typos and poke at its weak points.
Further Reading
Designing for Performance, Lara Hogan
From Milliseconds to Millions: A Look at the Numbers Powering Web Performance, Harry Roberts
Metrics by Proxy, Sophie Alpert
Mind over Matter: Optimize Performance Without Code, Stephanie Walter