With our current tools it’s relatively easy to examine the performance of a single page, or the performance of a journey a visitor takes through a series of pages but when I examine a client’s site for the first time I often want to get a broad view of performance across the whole site.
There are a few tools that can crawl a site and produce performance reports, SiteSpeed.io from Peter Hedenskog and NCC Group’s (was Site Confidence) Performance Analyser are two I use regularly.
Sometimes I want more than these tools offer - I might want to test from the USA or Japan, or want some measurements they don’t provide - that’s when I use my own instance of the HTTP Archive.
HTTP Archive
I run a customised version of the HTTP Archive using my own instance of WebPageTest (WPT) using test agents at various locations.
Getting the HTTP Archive up and running is a bit fiddly but not too hard.
I didn’t make any notes when I got my own instance up and running but Barbara Bermes wrote a pretty good guide - Setup your own HTTP Archive to track and query your site trends
My own instance is slightly different from the ‘out of the box’ version:
The batch process that submits jobs to WebPageTest, monitors them and then collects the results is split into two separate processes:
- Submit the tests (I monitor the jobs via WebPageTest until they’ve completed)
- Collects the results for completed tests, parses the results and inserts into DB
I’ve also introduced some new tables, one which maps WPT locations to friendly names, and another which groups URLs to be tested so that I can test subsets of pages, a page across multiple locations, multiple browsers etc.
These changes will be open sourced at some point later this year (some of the changes were part of a client engagement and they’ve agreed they can be released - probably in the Autumn)
Exploring a site
To gather the URLs to be tested I often crawl a site with sitespeed.io or another crawler before inserting the URLs manually into the HTTP Archive DB (spot the automation opportunity).
Once the URLs are in the DB, I schedule the tests with WPT, and collect the data when the tests complete.
Although I use the HTTP Archive for data collection and storage, I don’t actually use the web interface to examine the data.
SQL
Small images that might be suitable for techniques like spriting, or larger images that should be optimised further are really easy to identify with simple SQL queries, such as:
select distinct url, respsize from requests where url like 'http://www.domain.com%' and mimetype like 'image/%' order by respsize desc;R
People are pattern matchers so I like to draw charts from the raw data using R (via R Studio) to extract and visualise it.
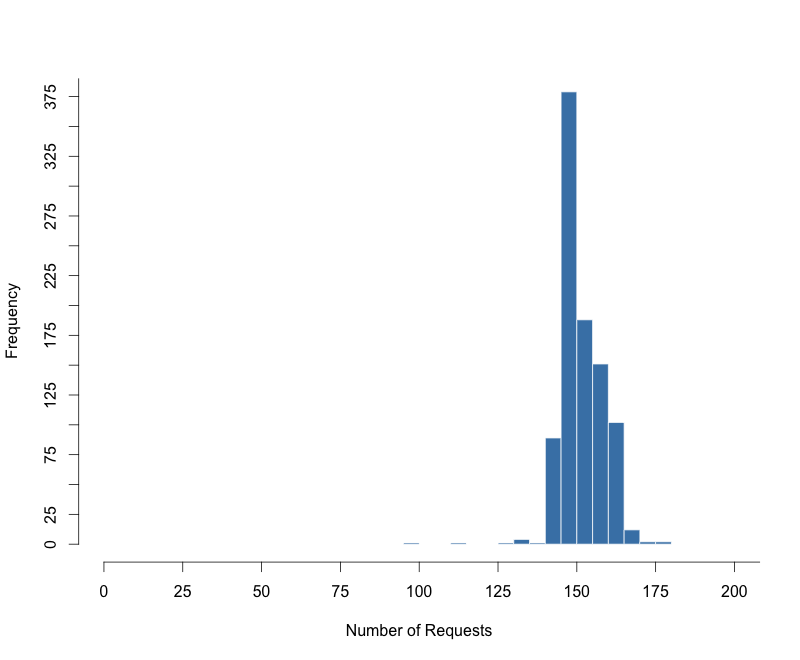
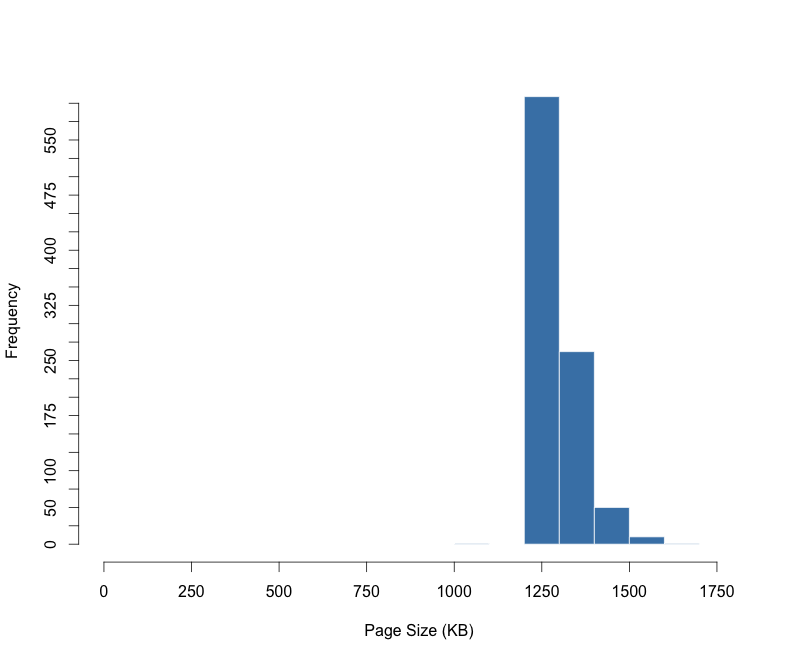
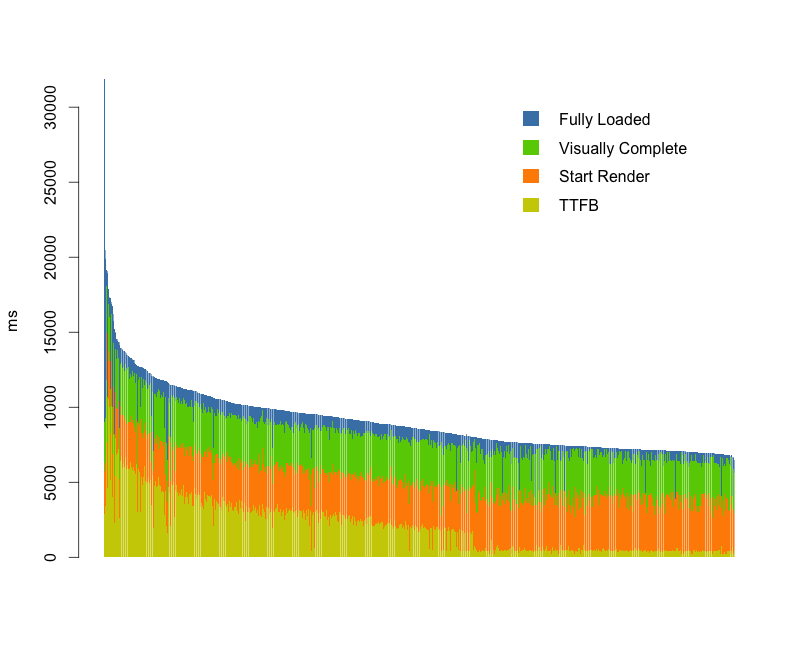
To start I typically plot the distribution of page size and requests per page, I also plot the load time of all pages split by the various loading phases.
Before plotting any charts we need to connect to the MySQL DB and extract the data we want as follows:
Install MySQL package (only once)
install.packages("RMySQL")Connect to the database, and create a data frame with the relevant data
library(RMySQL)

drv = dbDriver('MySQL')

con = dbConnect(drv, user='user’, password='password', dbname='httparchive', host='127.0.0.1')

results = dbGetQuery(con,statement='select url, wptid, ttfb, renderstart, visualcomplete, onload, fullyloaded, reqtotal, bytestotal, gzipsavings from pages where url like "http://www.domain.com%" order by bytestotal desc;')
R Studio now has data frame named results that contains the data extracted from the DB and charts can be plotted from this.
Requests / Page Histogram
hist(results$reqtotal, xlim=c(0,200), ylim=c(0,375),breaks=seq(0,200,by=5), main="", xlab="Number of Requests",col="steelblue", border="white", axes=FALSE)
axis(1, at = seq(0, 225, by = 25))
axis(2, at = seq(0, 400, by = 25))
Page Size Histogram
hist(results$bytestotal / 1000, col="steelblue", border="white", breaks=seq(0,1800,by=100), xlim=c(0,1800), axes=FALSE, plot=TRUE, main="", xlab="Page Size (KB)")
axis(1, at = seq(0, 1800, by = 250))
axis(2, at = seq(0, 600, by = 25))
Timing breakdown
Creating a chart to display the load time is a little more complicated, first we extract just the columns we're interested in, then sort them by the fully loaded time, then calculate the size of each bar segment before plotting it.
timings <- results[, c("ttfb", "renderstart", "visualcomplete", "fullyloaded")]
timings <-timings[order(-timings$fullyloaded),]

diff <- data.frame(ttfb=timings$ttfb, renderstart=timings$renderstart - timings$ttfb, visualcomplete=timings$visualcomplete - timings$renderstart, fullyloaded=timings$fullyloaded - timings$visualcomplete)

barplot(t(diff), legend=c("TTFB", "Start Render", "Visually Complete", "Fully Loaded"), col=c("yellow3", "darkorange", "chartreuse3", "steelblue"), border=NA, width=1, ylab="ms", bty="n", args.legend = list(border=NA, bty="n"))
In this chart there's a clear pattern for TTFB - the pages with low times are all product pages, and the pages with longer TTFBs are pages such as category pages a visitor would need to drill through to reach a product page.
Some of the charts don't display as clearly as I would like e.g. the timing breakdown has bands and the charts axes normally need some fiddling with. Brushing up my R so I can automate this process further and create better charts is on my todo list!
I know Steve didn't intend the HTTP Archive to be something everyone hosted for themselves but it makes a pretty handy tool for bulk testing, and tools like R make it easy to visualise the data to get an understanding of site performance.